Break-even ROAS calculator for multi-brand retailers
Your suppliers set your margin. This tells you the ROAS you need before Google Ads makes you a penny.
Runs entirely in your browser. No account, no email, no data sent to our servers.
Your break-even ROAS
4.55×
You are 0.75× below the line – ads are not covering cost of goods and media.
Contribution after product costs and ad spend (per month)
-1,640
Negative means you are losing money on paid traffic at this ROAS.
We'll tell you which brands sit below your line.
Get the free audit – we'll tell you which brands sit below your lineHow this compares to the electronics retail benchmark
Public industry references for Google Shopping in electronics put average ROAS around 3.8×. Pure-play electronics retail gross margin sits near 22% – which means a break-even threshold of about 4.55×. Hitting the category average can still mean a loss.
Margin → break-even ROAS
| Gross margin | Break-even ROAS |
|---|---|
| 15% | 6.67× |
| 20% | 5.00× |
| 22% | 4.55× |
| 25% | 4.00× |
| 30% | 3.33× |
| 40% | 2.50× |
Sources: public Google Shopping electronics ROAS benchmarks (2026) and pure-play electronics retail gross-margin averages. Industry figures – not WeAdU client results.
Why a category-average ROAS can still lose money
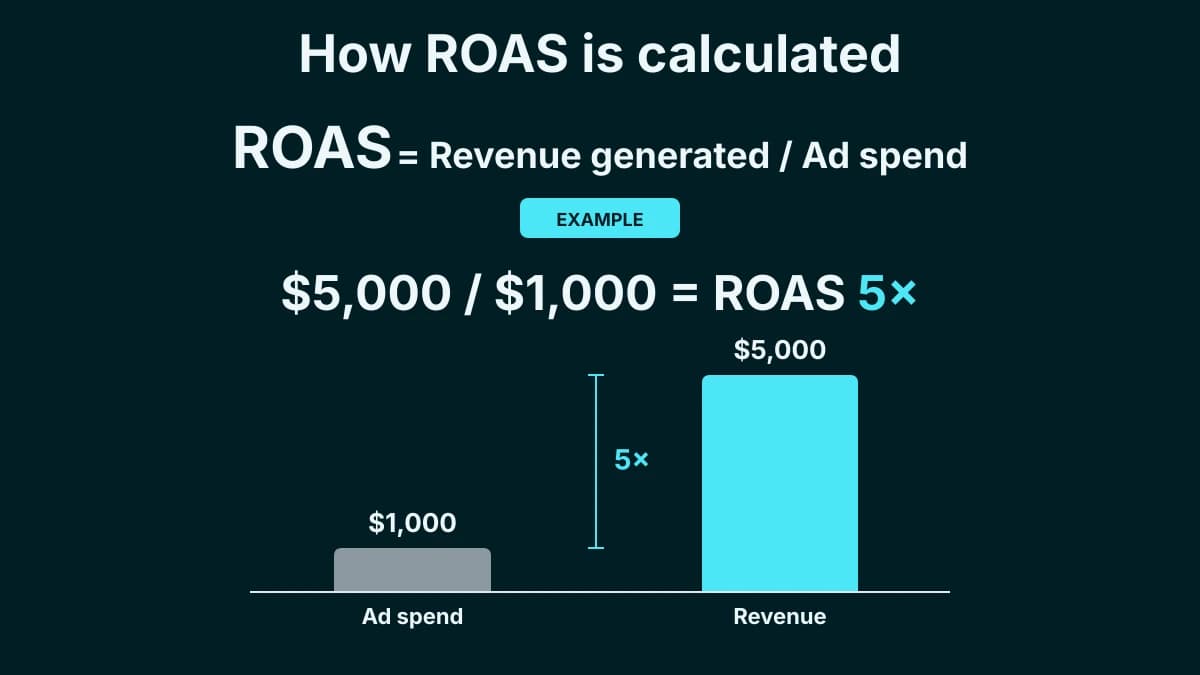
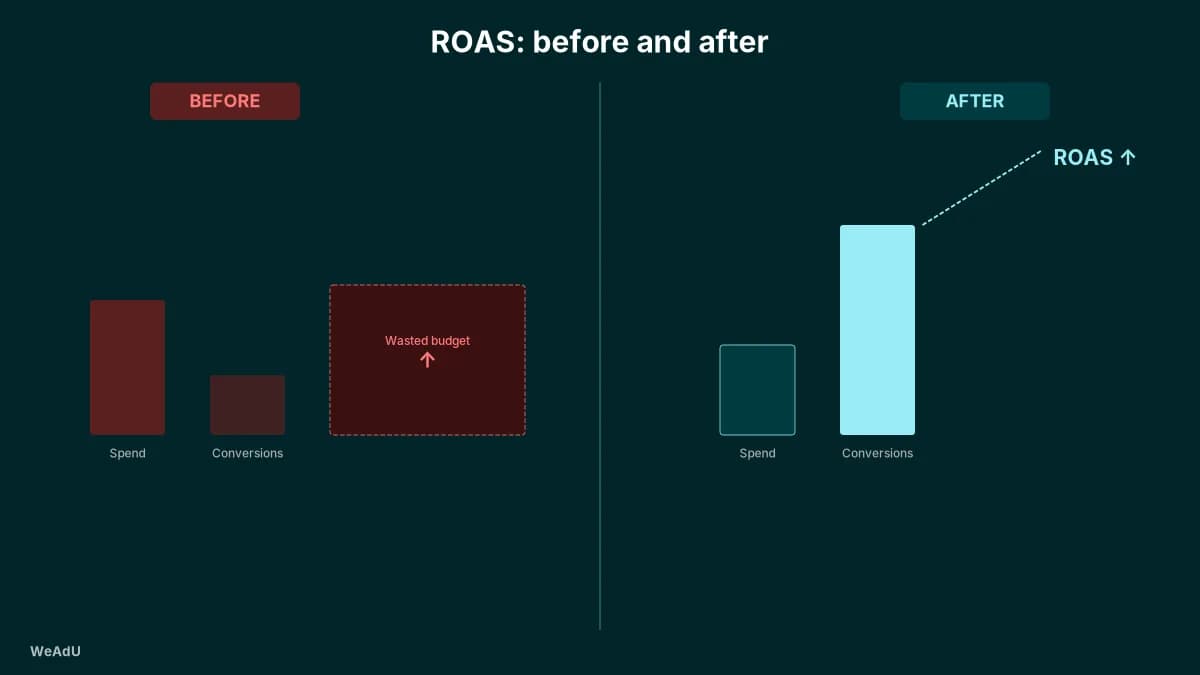
ROAS measures revenue returned per ad dollar – not profit. When suppliers lock your margin at 20–25%, you need 4×–5× before a single ad dollar covers cost of goods and media. Category averages ignore that math. If your ROAS sits under your break-even line, every click digs deeper – brand by brand.